Leveraging Embrace for React Native App Health Monitoring - Part 1.
Setup and Performance Monitoring
Building Great Apps with React Native
Introduction
Why Embrace
A month ago at work, we were contacted about a platform called Embrace, which offers similar features to Datadog but at a more reasonable price. I've migrated our app infrastructure to Embrace and have been happy since then.
Back then there were not many articles about this platform, hence I've noted things down in case anyone is interested.
Importance of App Health Dashboards
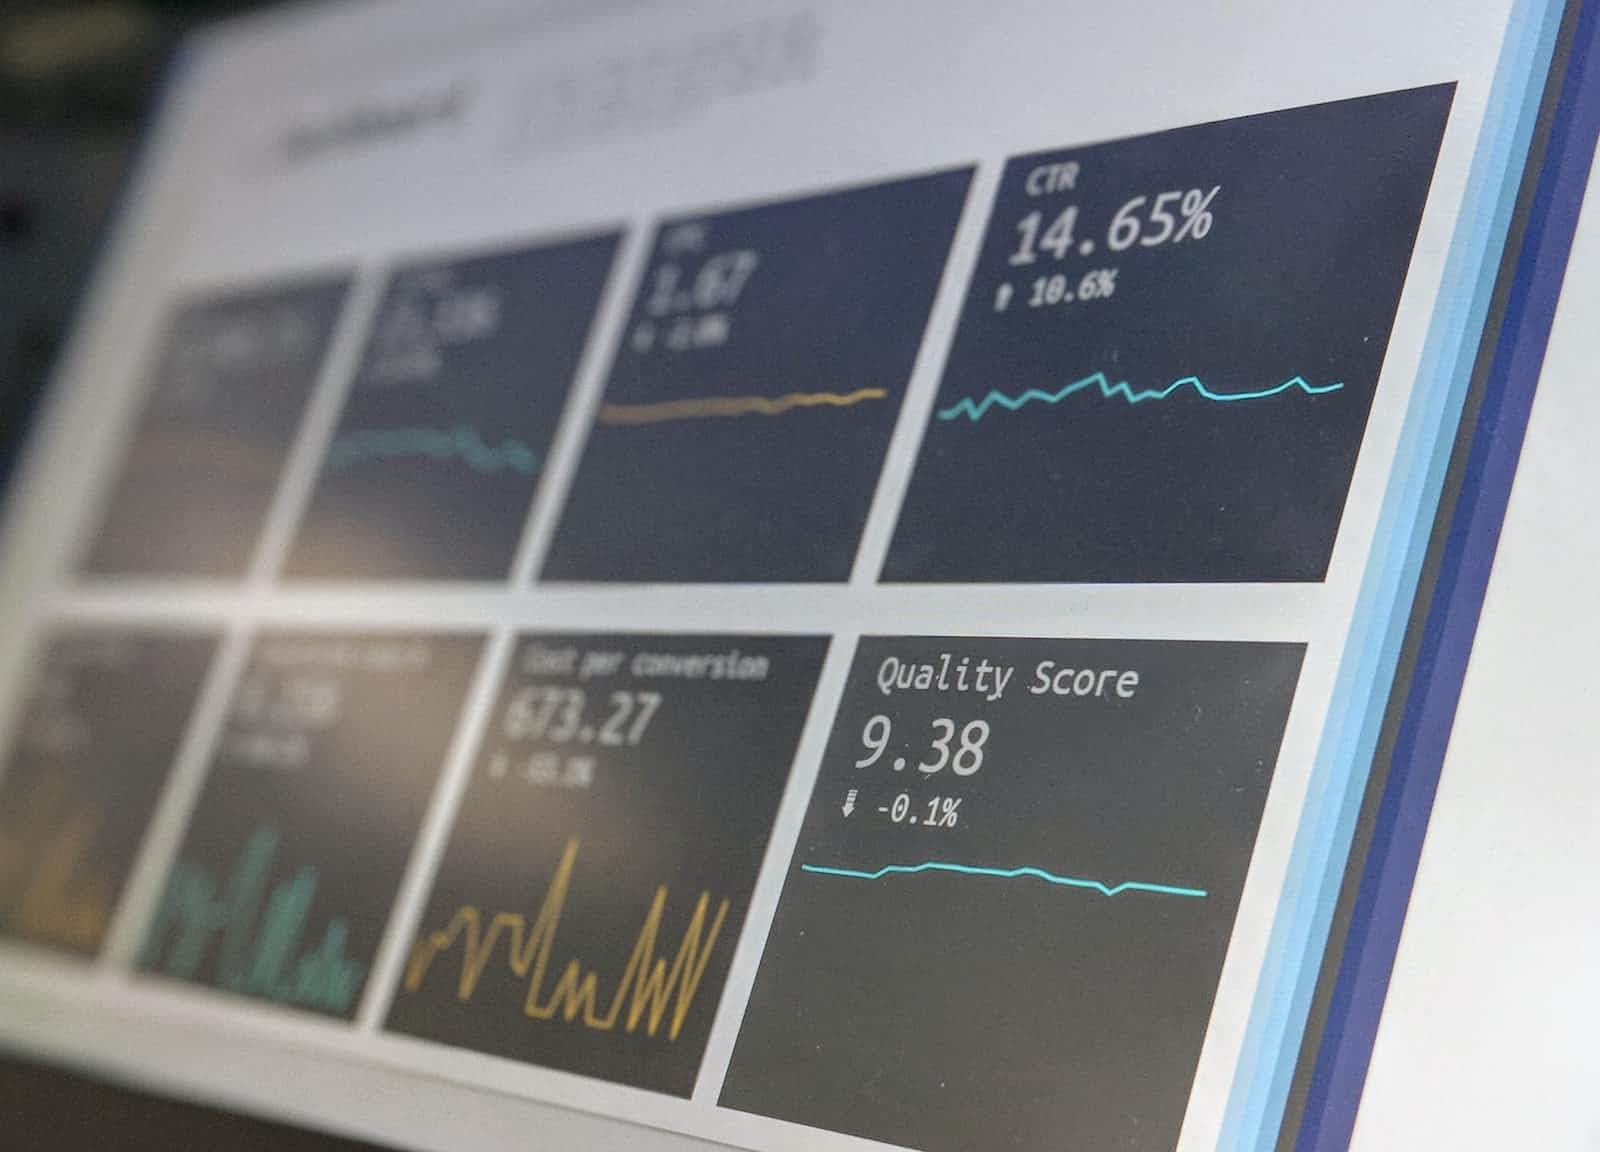
App Health Dashboards are crucial tools for monitoring the performance and stability of software applications. By providing real-time insights into key metrics such as uptime, response times, and error rates, these dashboards empower development teams to promptly identify and address issues, minimizing downtime and ensuring a seamless user experience. Their ability to offer a comprehensive overview of an app's health not only streamlines troubleshooting but also aids in making informed decisions for optimizations, ultimately enhancing user satisfaction and business success.
Setting up Embrace SDK
Sign up to Embrace and Select the design platform. If you use both Android and iOS, you'll need to set up them separately.

In this post, I'll focus on the Android portion. However, the process is quite similar to the iOS setup.
Add the Javascript Library
yarn add react-native-embrace
Add the SDK
node node_modules/react-native-embrace/dist/scripts/setup/installAndroid.js
You'll be prompted to enter the Embrace App ID and API token
What the prompt does is initialize the SDK at the App start.
import io.embrace.android.embracesdk.Embrace;
import android.app.Application;
...
  public void onCreate() {
    super.onCreate();
    Embrace.getInstance().start(this, false, Embrace.AppFramework.REACT_NATIVE);
  }
...
Setup the javascript Part
    import React, {useEffect, useState} from 'react'
    import {endAppStartup, initialize} from 'react-native-embrace';

    const App = () => {

      useEffect(() => {
        initialize();
        endAppStartup();
      }, []);

      return ...
    };
Build the app and check the Dashboard
The final step is to build the App and test it. You'll need to relaunch the App to ensure the Embrace event is properly sent. Head to the Embrace website and in your project you shall see similar charts in the Sessions tab.

Enable only for production (Optional)
In case you only want to enable Embrace for Production. You could do similar to the following:
Native part.
 if (BuildConfig.ENV.equals("production") && !BuildConfig.DEBUG) {
  Embrace.getInstance().start(this, false, Embrace.AppFramework.REACT_NATIVE);
 }
Javascript Part.
useEffect(() => {
   if (isProductionRelease()) {
       initialize();
       endAppStartup();
   }
}, []);
Monitoring App Performance
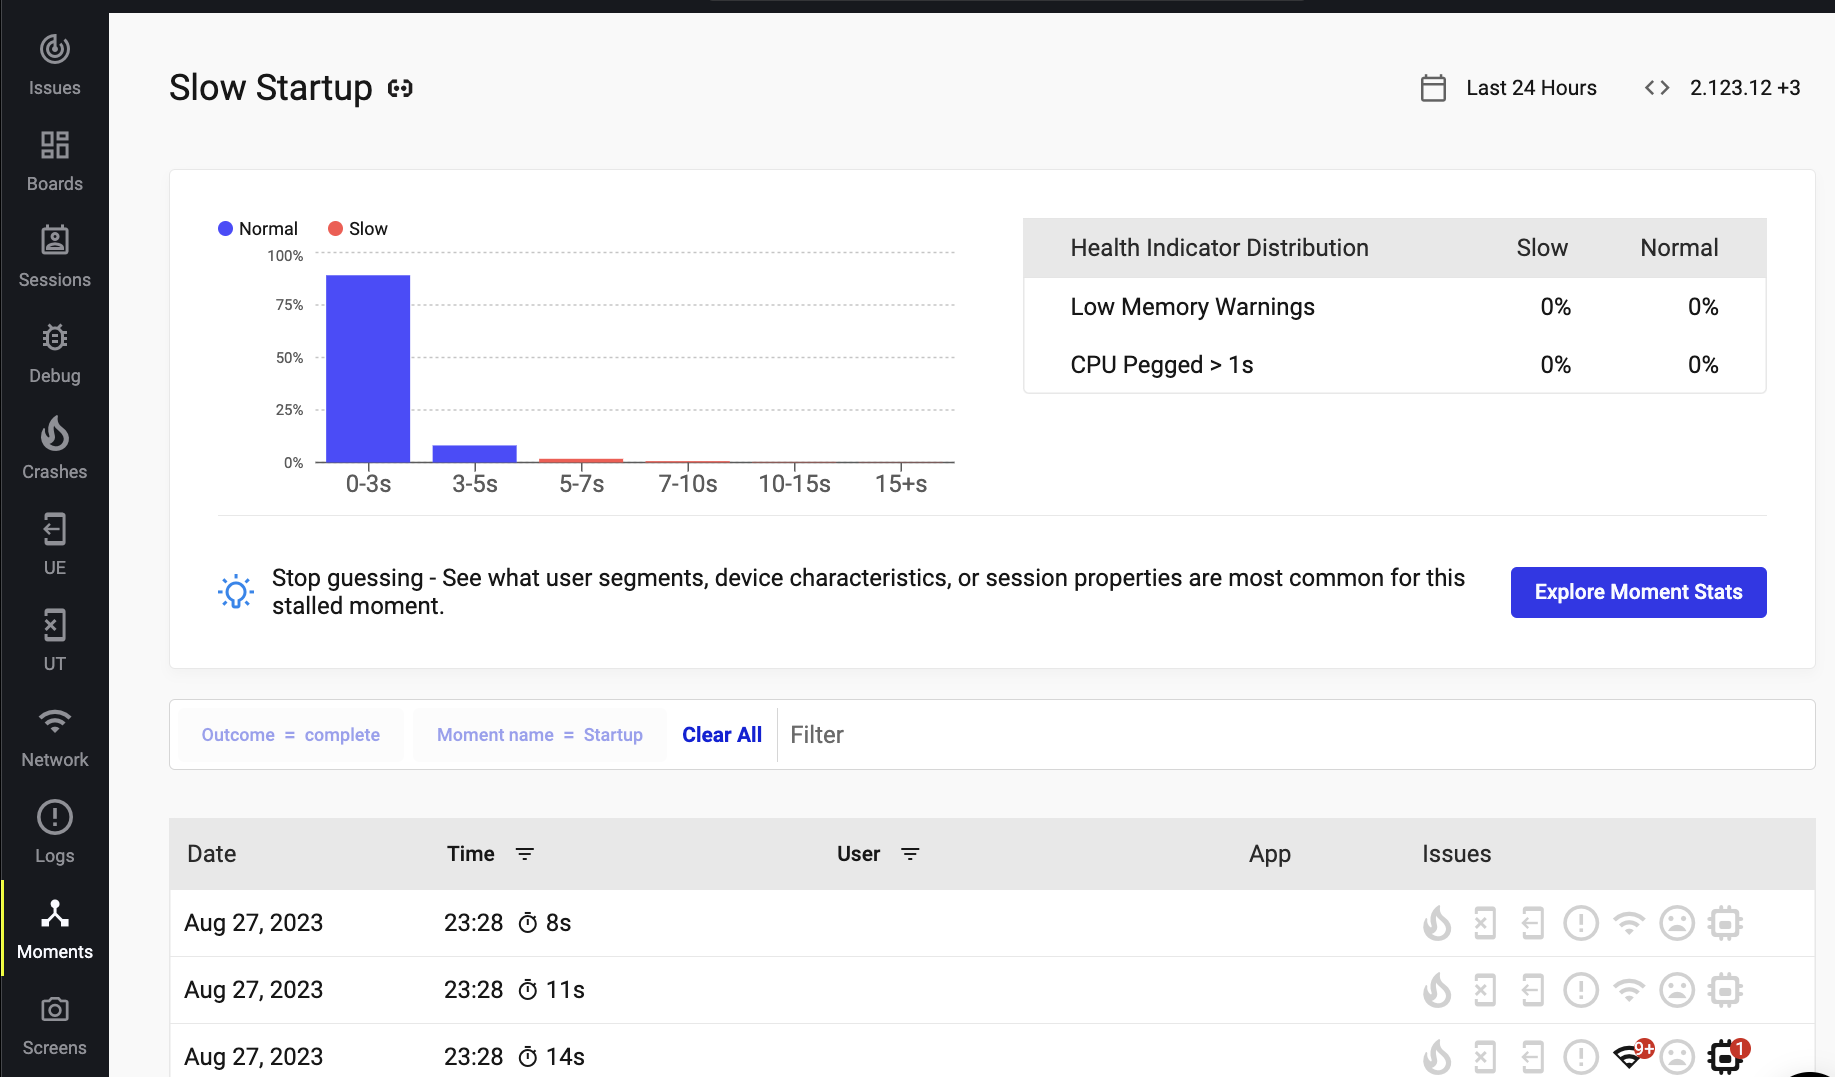
Monitoring app startup time
Once you gather info data on Production, you shall see something similar in the Moments Tabs. (The bar chart is a clear overview of what your App startup time looks like.)
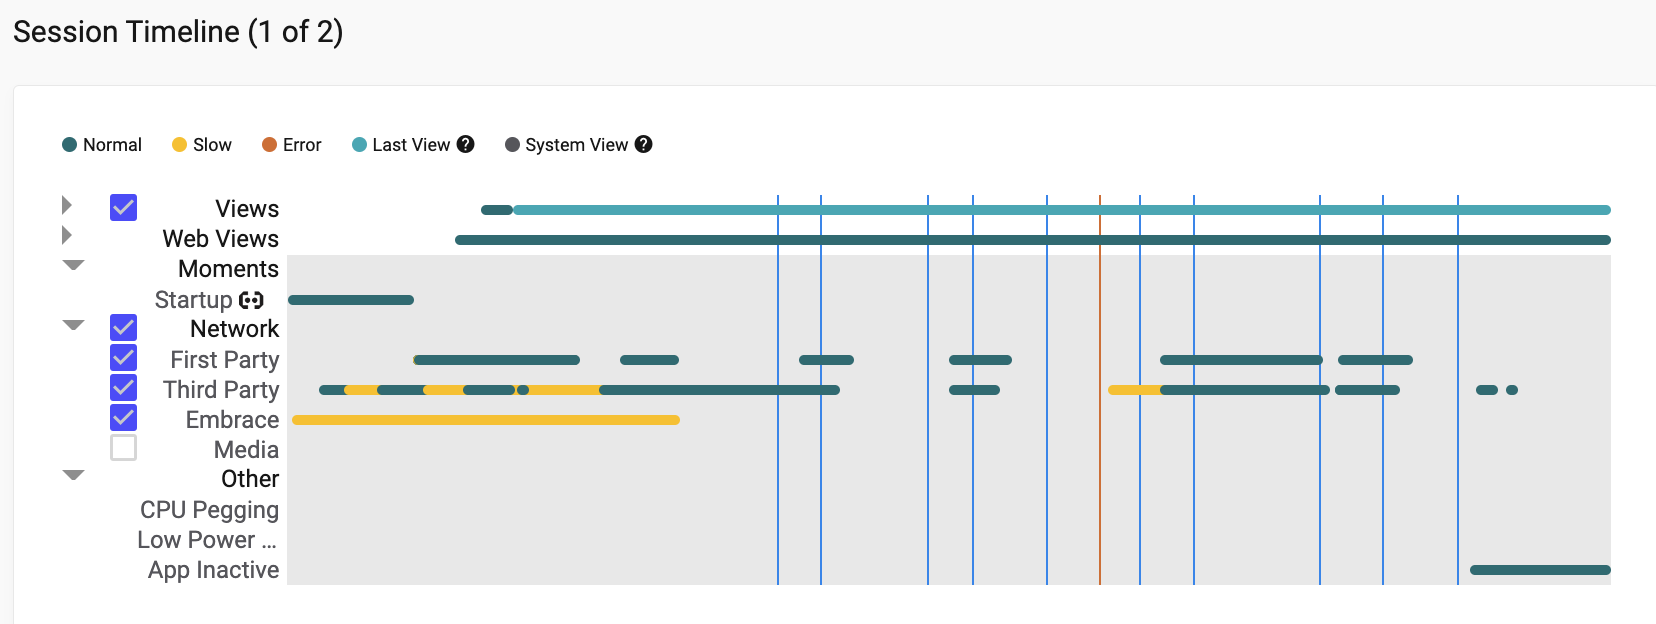
Identifying bottlenecks
Next, to further investigate the issue, you could click on the slow sessions and examine the timeline charts.
Conclusion
In this article, we discuss the importance of App Health Dashboards and introduce Embrace, a cost-effective platform for app monitoring. We provide a step-by-step guide on setting up the Embrace SDK for Android and demonstrate how to monitor app startup time and identify bottlenecks. Embrace can be a valuable tool for development teams, enhancing user satisfaction and business success.
Thank you for reading this far. In the next series, we will provide a walkthrough of Embrace and its features, as well as discuss customization options. Stay tuned.