


Photo by Stephen Phillips - Hostreviews.co.uk on Unsplash
Leveraging Embrace.io for React Native App Health Monitoring - Part 2.
Features overview and Customisation


Introduction
In Part 1, we went through the basic setup for Embrace SDK. In this following series, we'll walk through the features so that you can have an overview of its capabilities. We'll discuss real-world scenarios for each feature and explain how they can be useful in various situations.
User Experience Analytics
Tracking user sessions
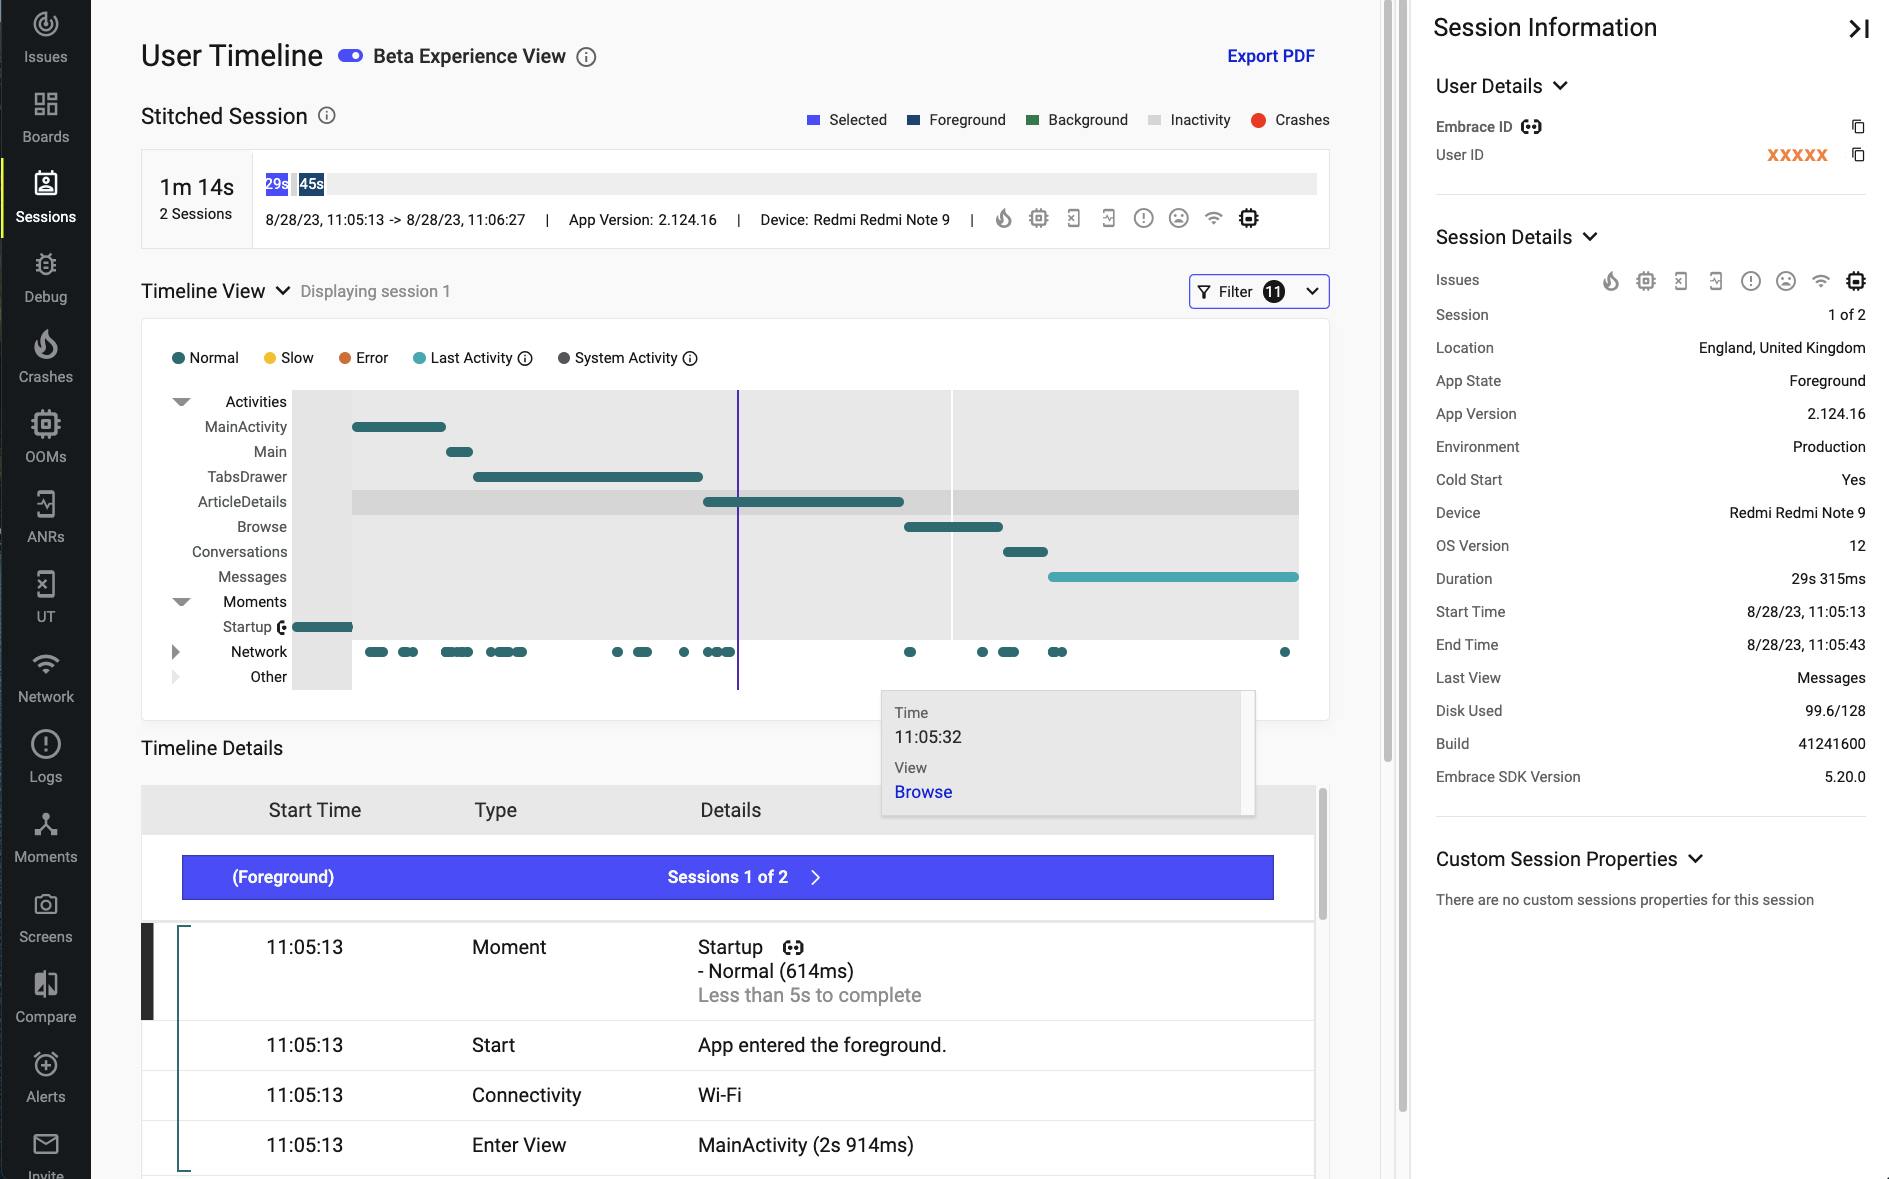
Here's an overview of what User Timeline looks like on the Sessions tab, there's lots of information here. We'll go through them one by one.
User engagement metrics
The Switched Session lets you choose which sessions you want to investigate. It also provides an overview of how a specific user is using the app. This is the place to go if you want to diagnose whether a user has any weird patterns.
Analyzing user behavior
In the Timeline View, we briefly mentioned this aspect in a previous post, but we'll delve a bit deeper here. If you'd like to have an overview of the user journey and understand at which points in time specific network requests are made, this is the right place for that. You should be able to easily identify any unnecessary API calls or unexpected patterns occurring. By clicking on each timeline, it will expand and reveal more information in the Timeline Details section.
Device types and OS versions...
Lastly, let's examine the right side of the screenshot above. The Session information offers a wealth of valuable data that can simplify your investigation. You can even add Custom Session Properties, such as A/B test groups and more.
App Health Dashboard
Default Boards
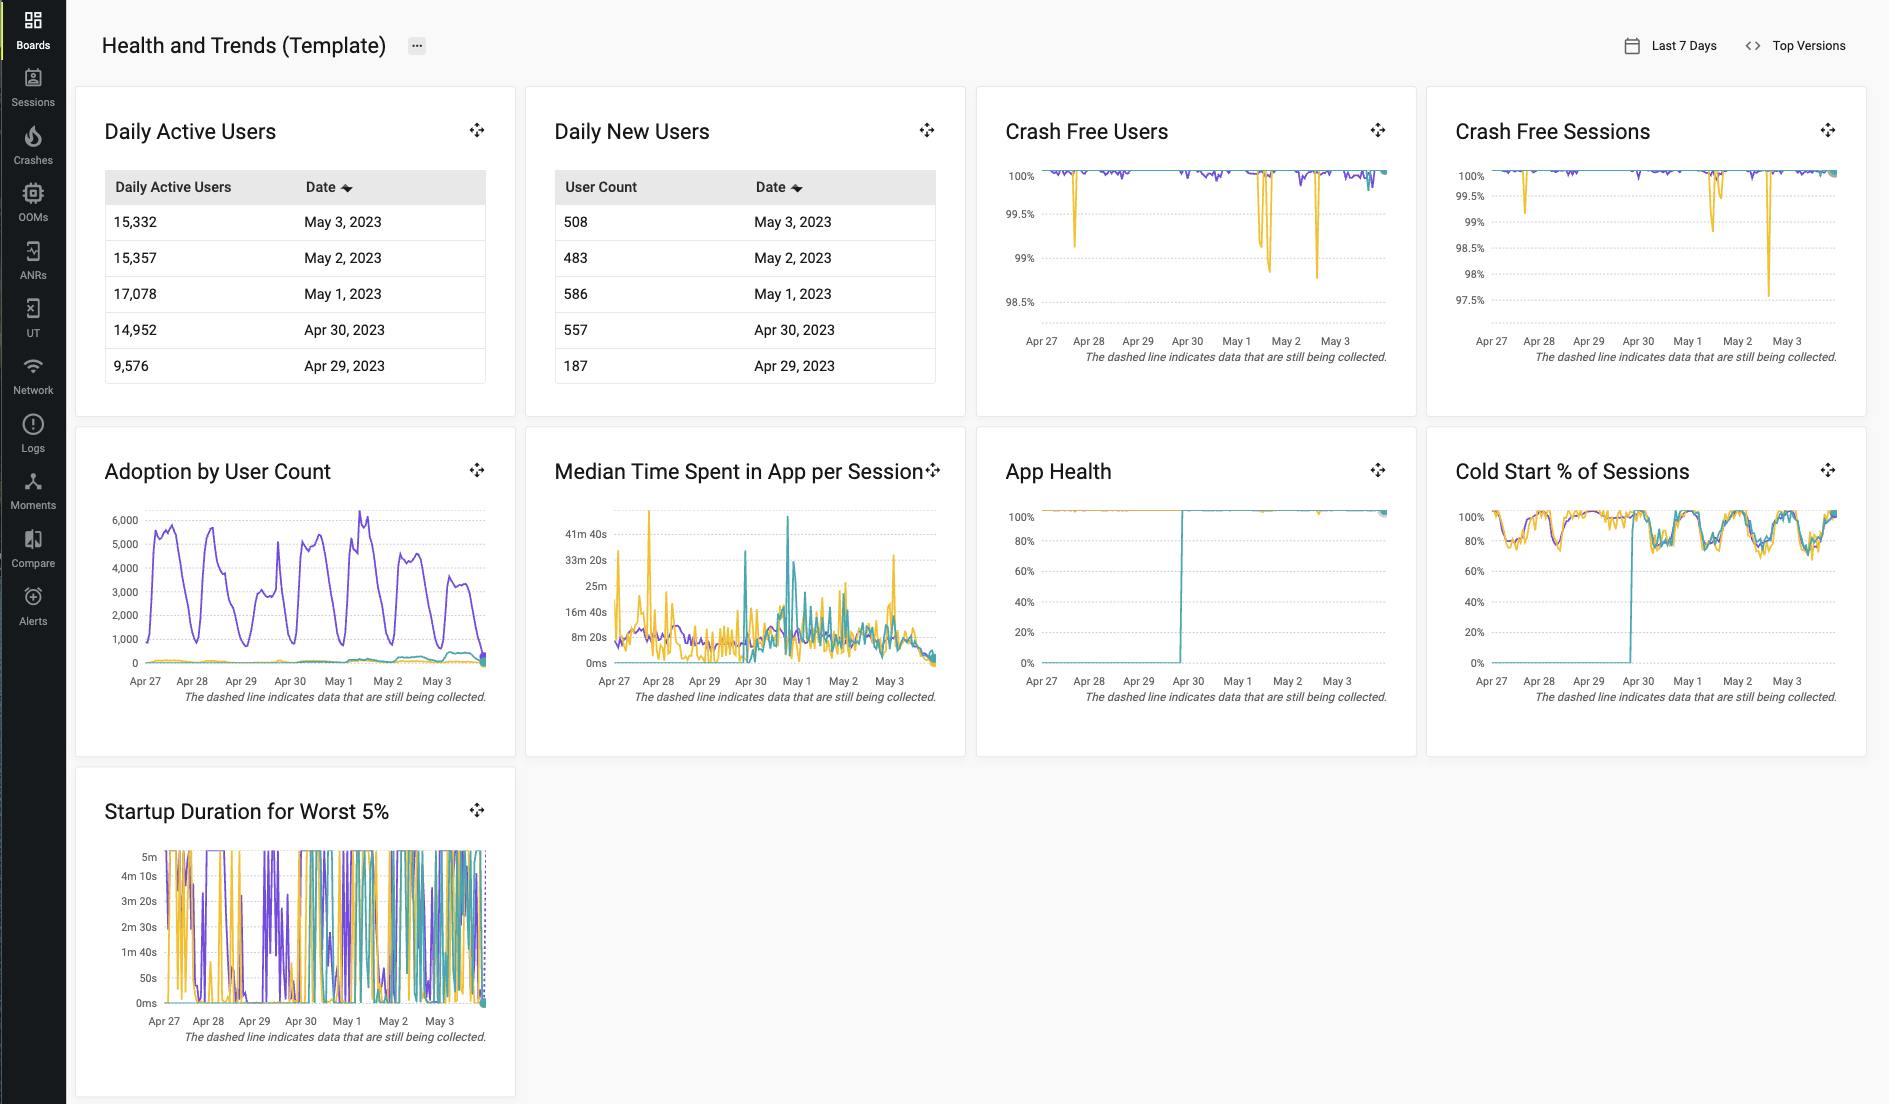
The beauty of Embrace is that the default Dashboard already comes with several useful metrics that you might need on a day-to-day basis. If the template dashboard does not meet your requirements, you can always modify it and create additional charts.
Crashes reporting
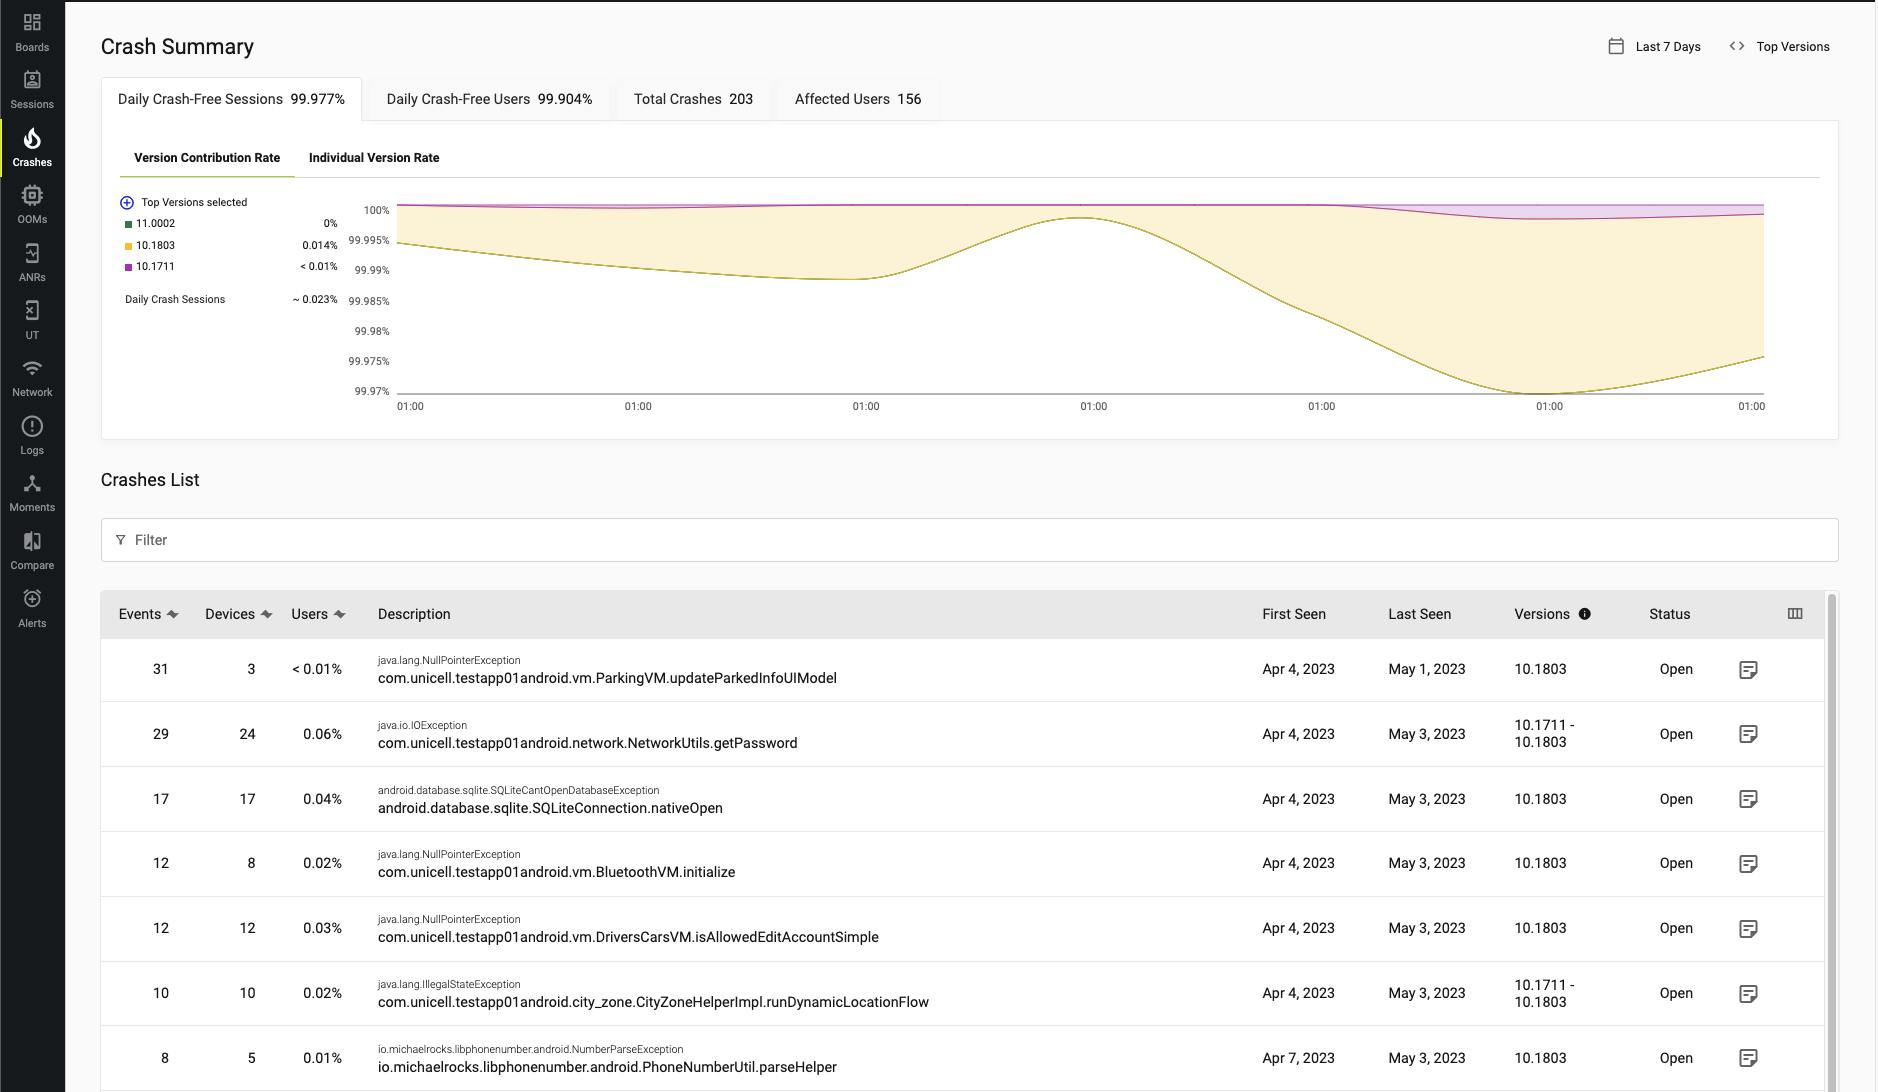
Crash Summary is extremely useful, particularly following app releases. You can effortlessly identify potential trending issues early on and monitor progress after implementing a fix. Besides, knowing which issues originated from specific app versions greatly assists in investigations as well.
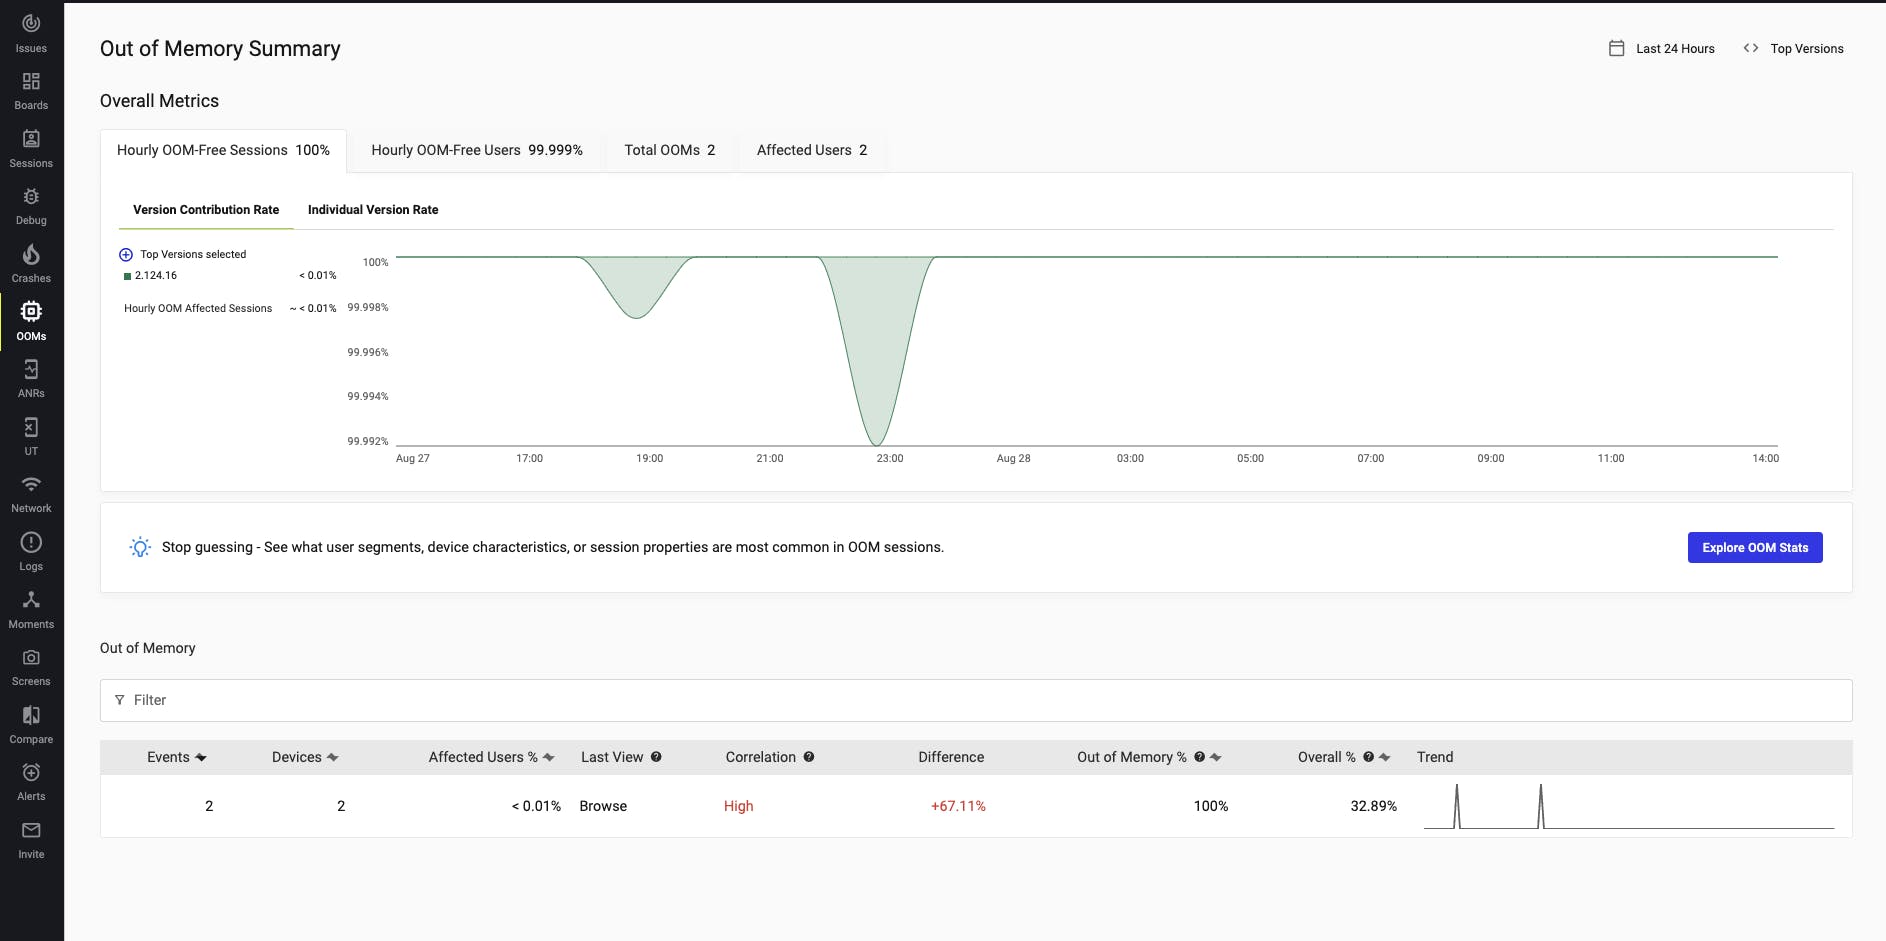
Out of memory
Without a monitoring system, memory issues can be extremely difficult to trace. With the tool in hand, you can easily gain an overview of your current system and identify the underlying bottlenecks.
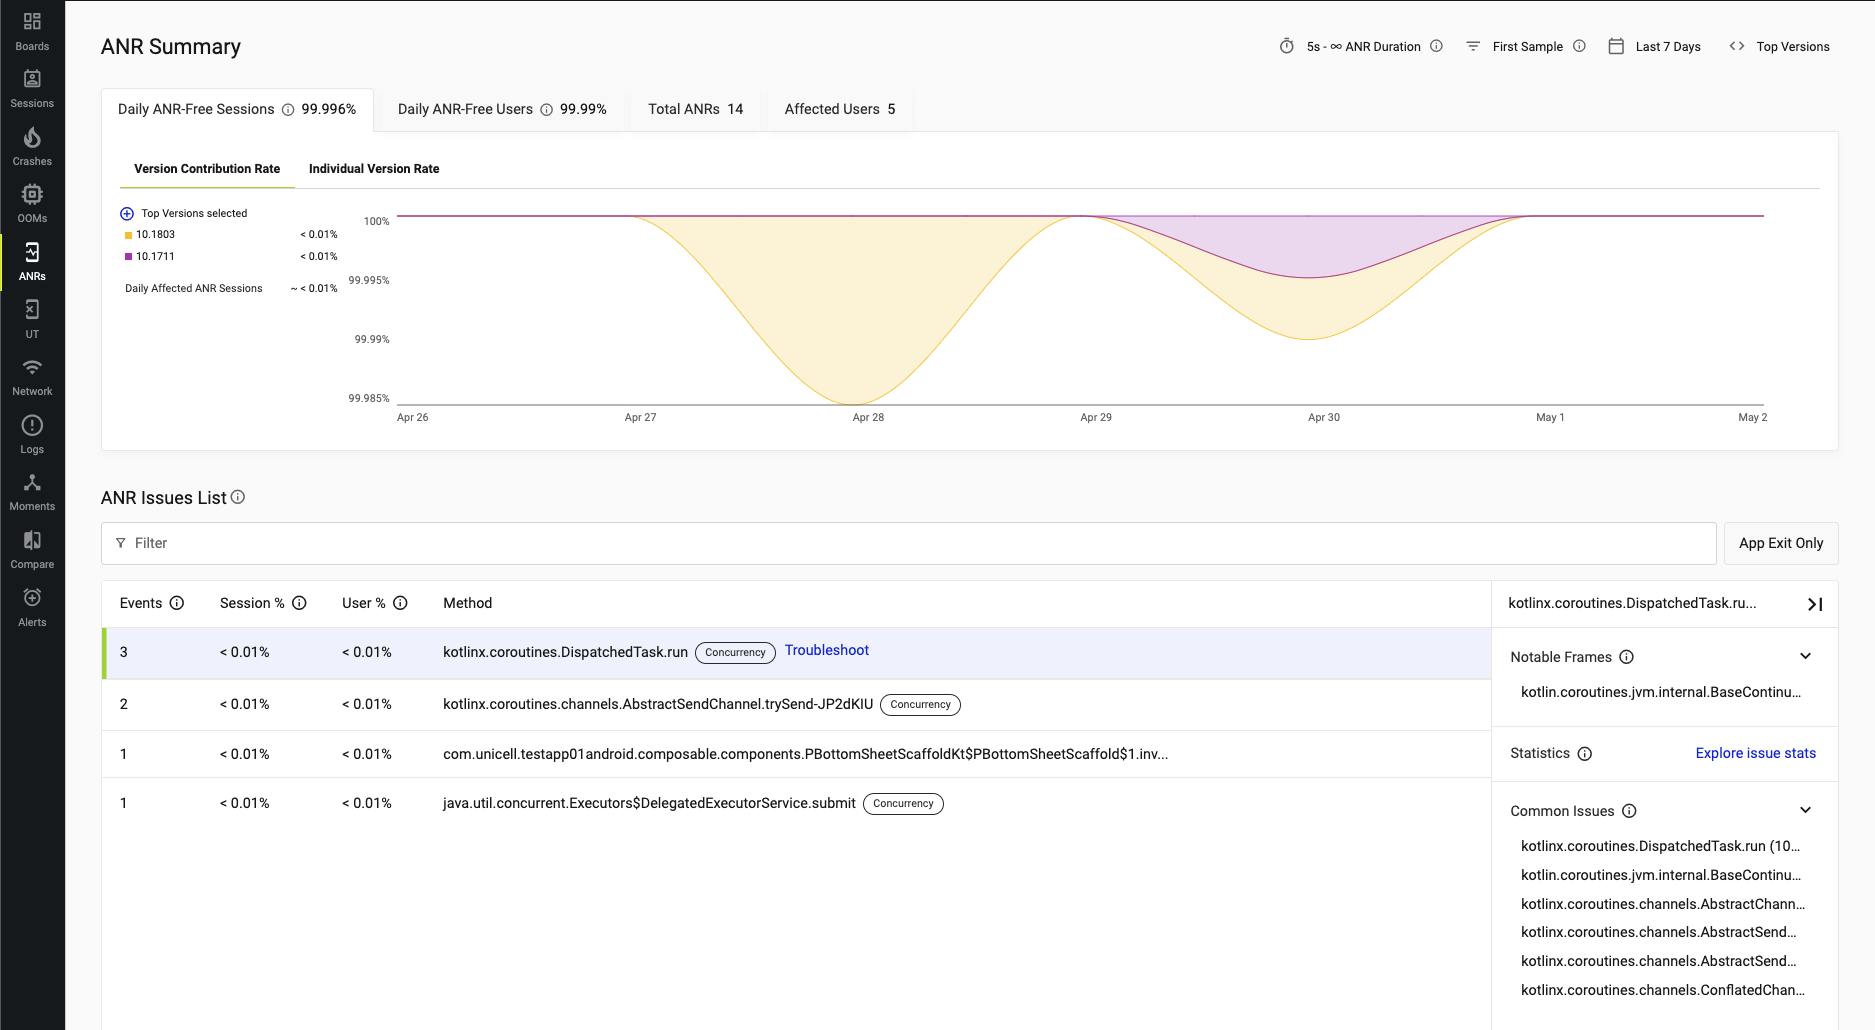
ANRs
ANR stands for "App Not Responding," and it represents the most frustrating type of issue that users are unhappy to encounter. With a monitoring system in place, you can easily determine the app's downtime and even devise improvement plans.
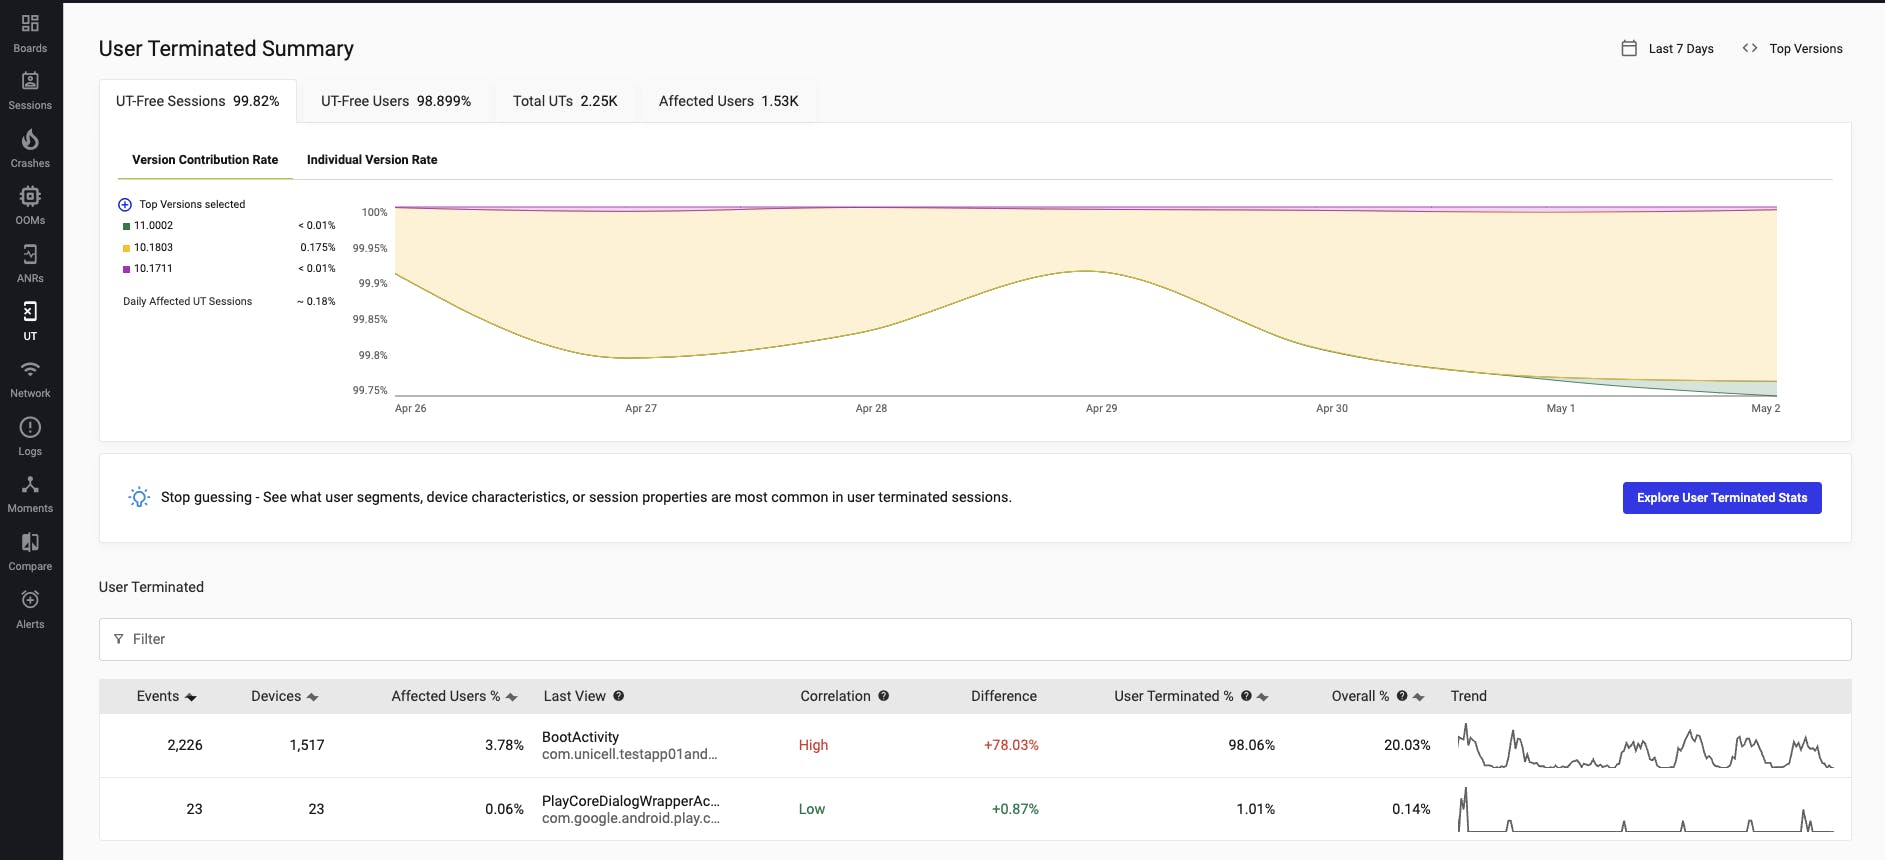
User Terminated Summary
Occasionally, a crash may be categorized as User Terminated. After releasing the app, you'll want to monitor this area closely as well.
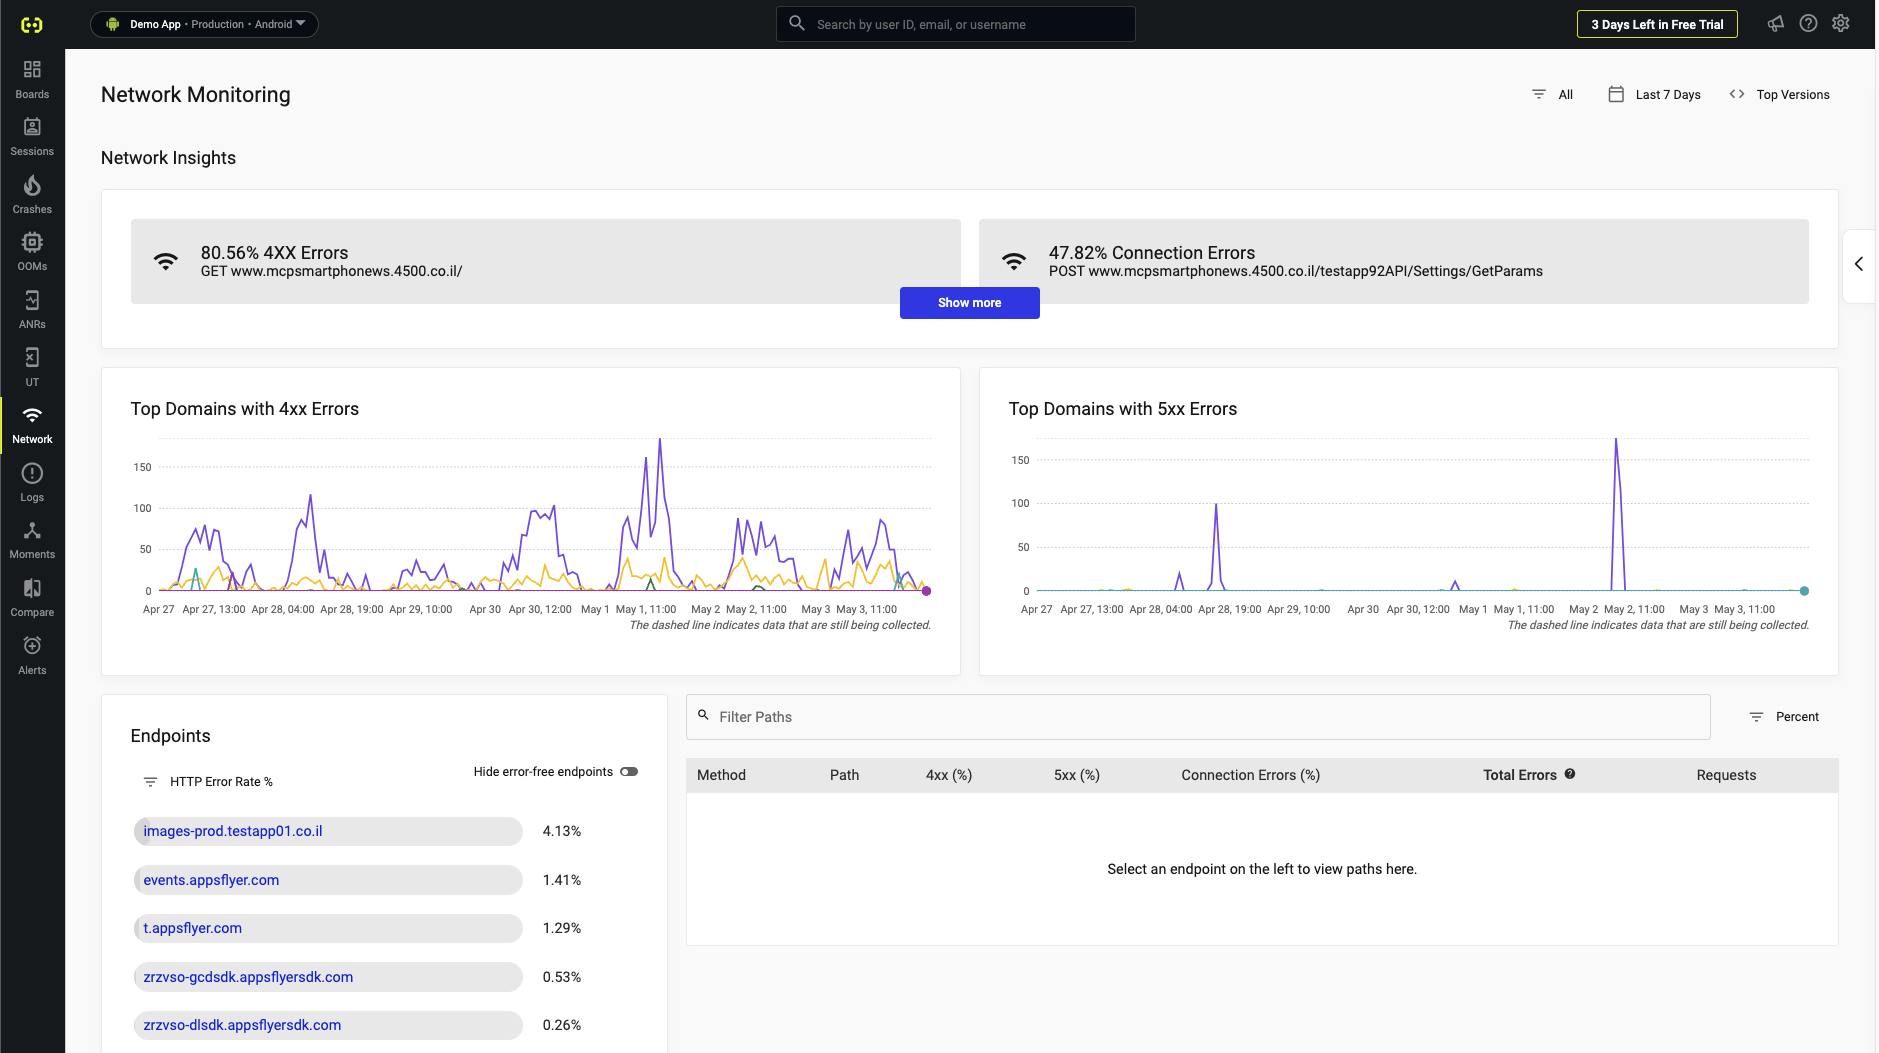
Network
Sometimes problems can happen on the backend too. With monitoring, you can quickly see which endpoint has issues. You can also find performance bottlenecks by checking latency.
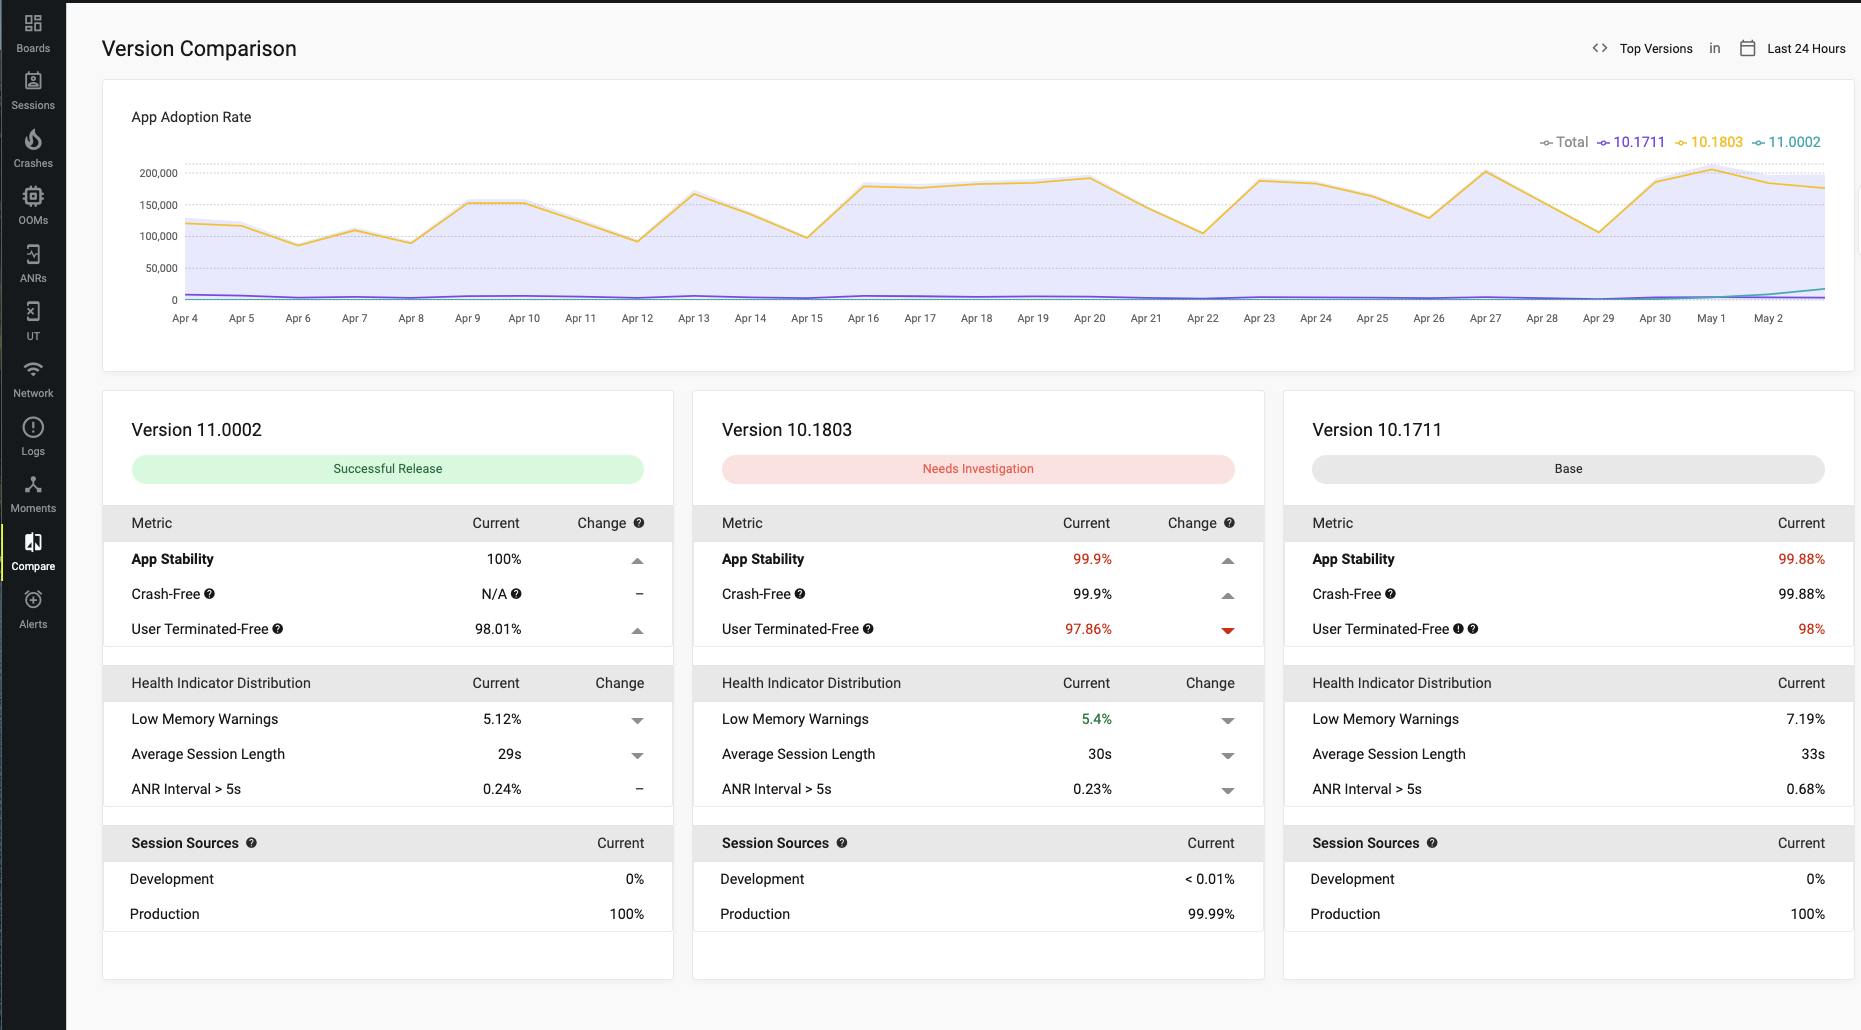
Version Compare
Among all the features we've explored so far, I've particularly enjoyed using version compare. I've had experience with Datadog before, and it required quite an effort to achieve something similar. However, with Embrace, it comes as a default feature. With zero configuration, your App Health Dashboard is readily available to you.
You'll be able to identify issues in a specific version with just a glance. This saves you a significant amount of time, as you won't have to compare different dashboards side by side, which can still make it difficult to discern the underlying problem.
Customizing App Health Dashboard
Creating custom dashboards
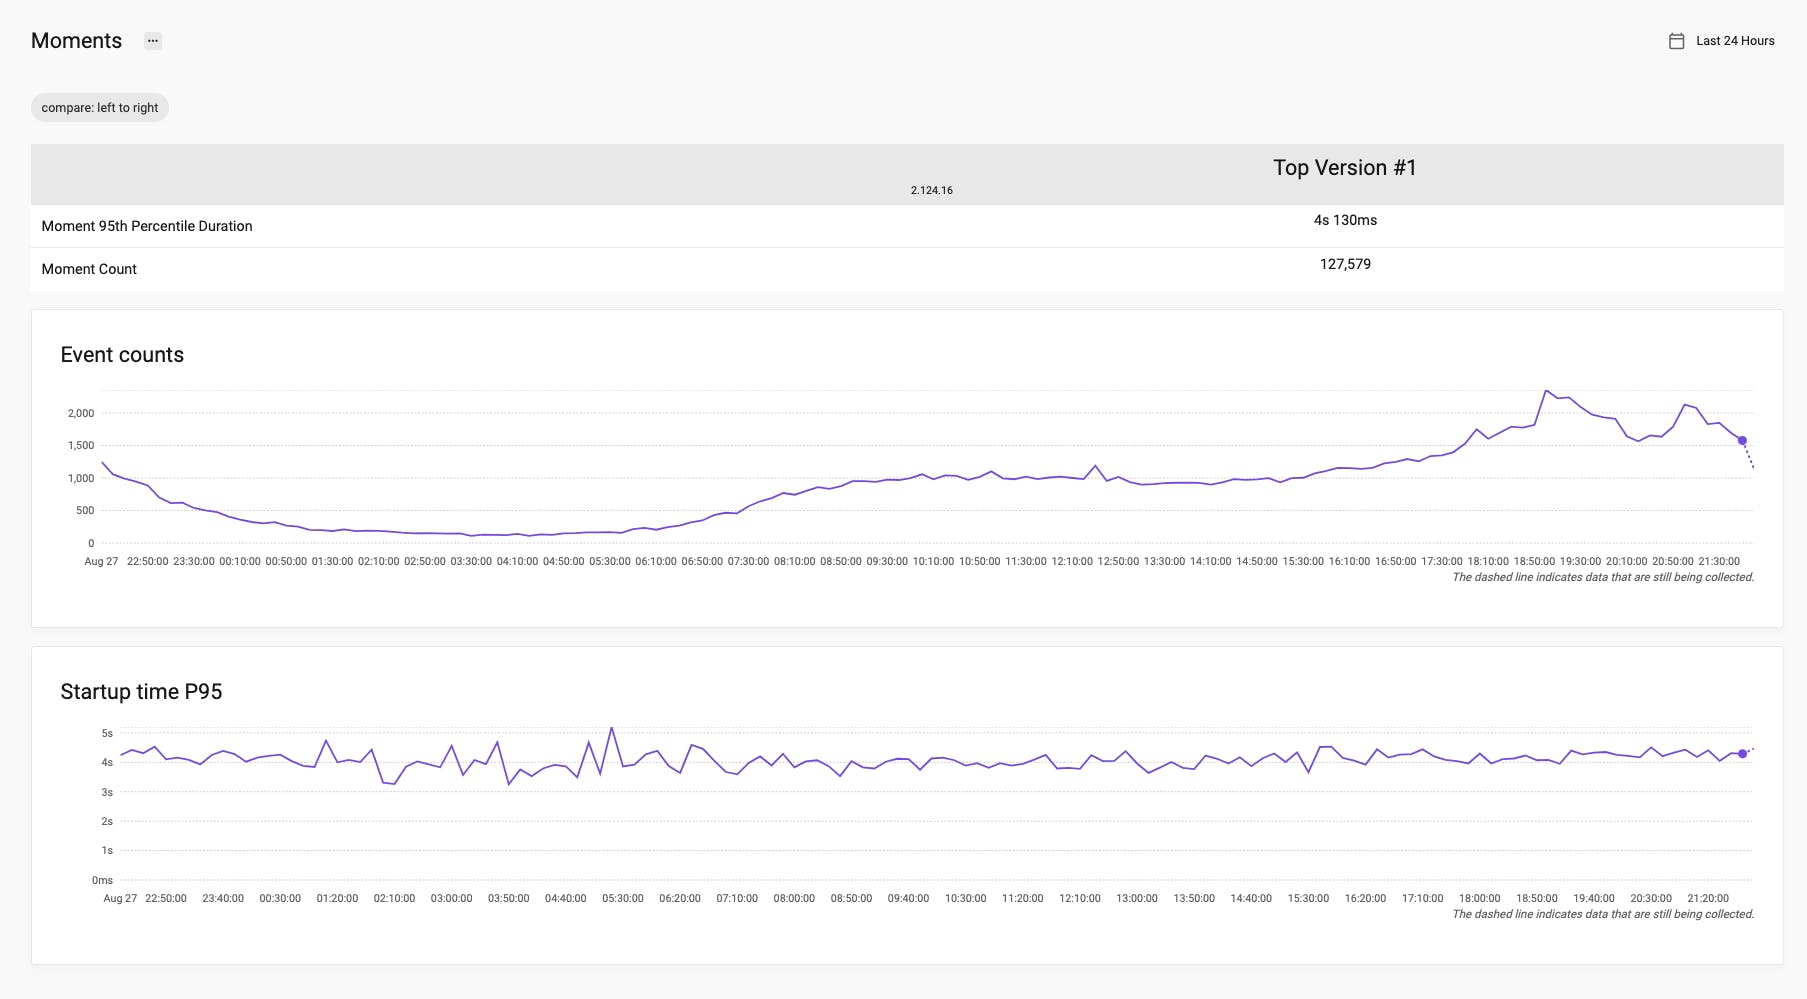
While the default template dashboard provides numerous valuable metrics, you may require something more tailored. You can always customize it to create a dashboard that meets your specific needs. For example, consider an App startup time overview for the 95th percentile; this is particularly useful if you are concerned about App performance.
Setting up alerts
You wouldn't want to spend your entire day on the dashboard; setting up alerts is a time-saving method. It's also a more reliable approach, as you no longer need to constantly worry about your system. When things go south, you'll receive an alert.
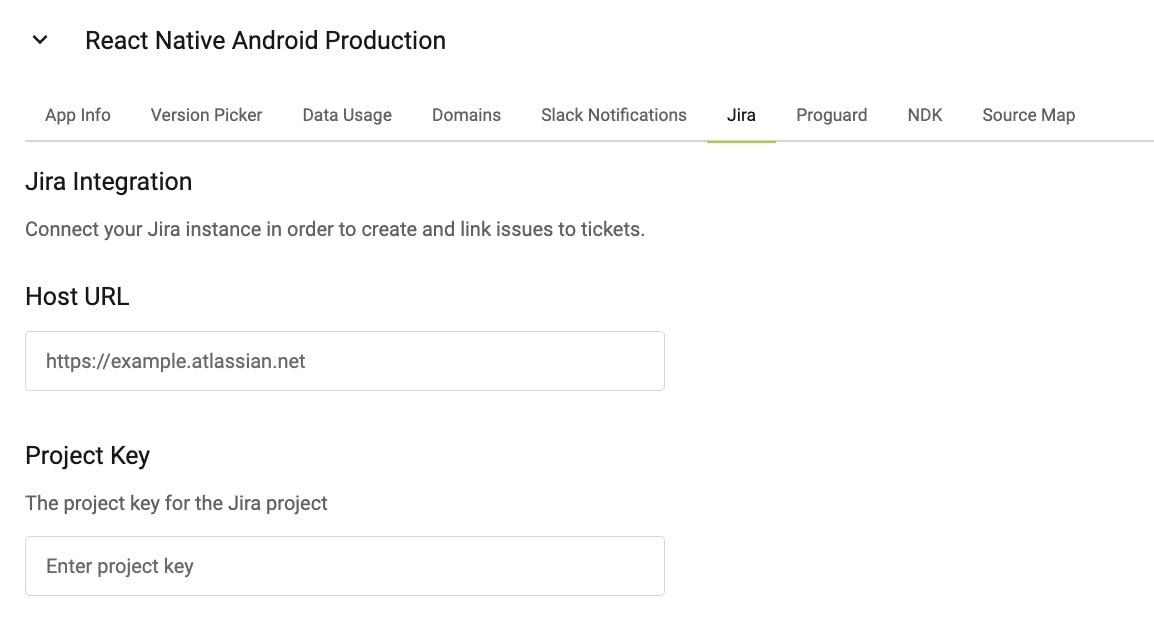
Integrate with Jira
In the Embrace Settings, you could set it up to integrate with Jira. To ease your issue ticket creation flow.
Troubleshooting and Support
Accessing Embrace.io documentation
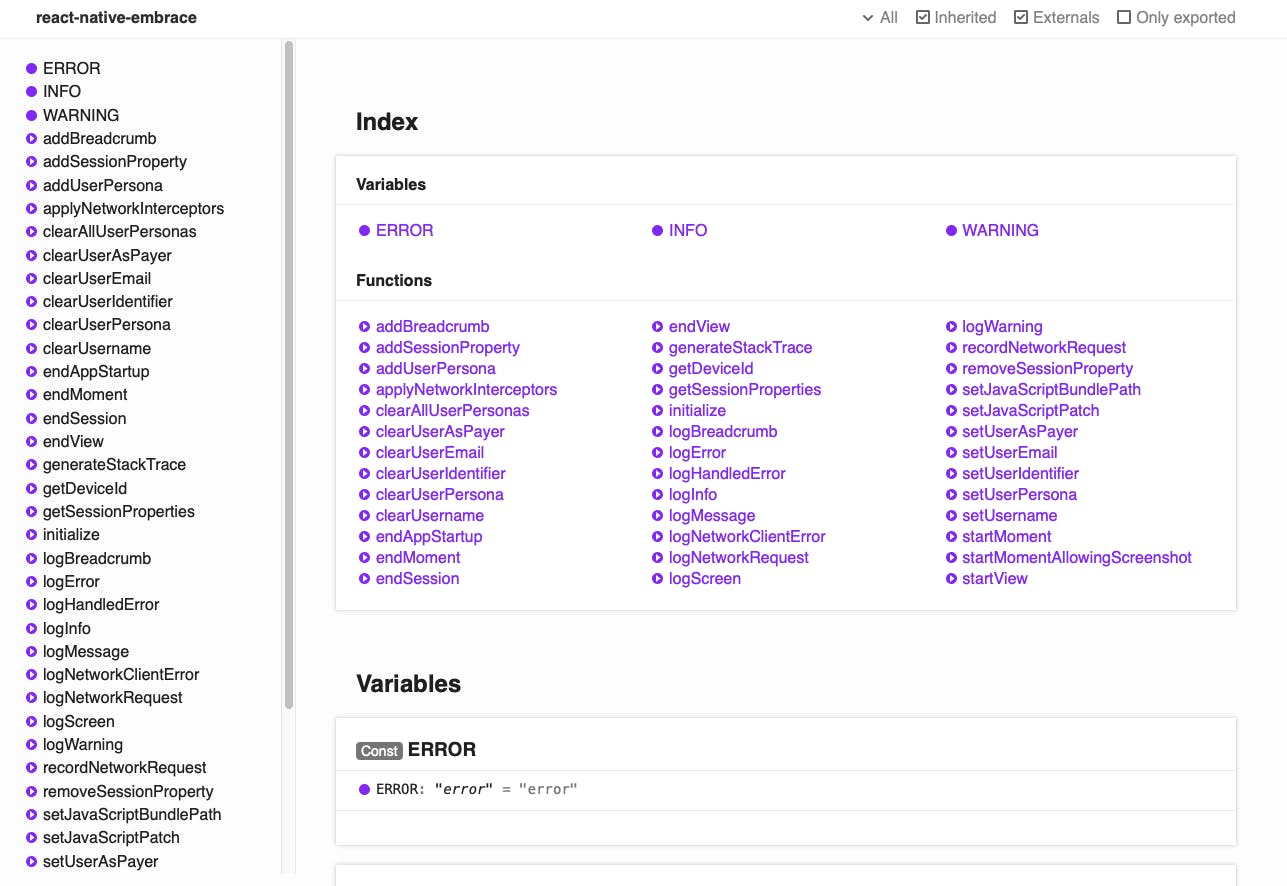
To learn more about Embrace and its capabilities, you can find additional information in its official documentation. If you are curious about what Embrace SDK offers you could dig in the API docs as well.
Contacting Embrace.io support
If you encounter any issues while integrating with Embrace, you can easily reach out to their customer support on the website. Based on my experience, they are nice and provide quick responses.
Conclusion
In conclusion, Embrace.io is a powerful tool for React Native app health monitoring, offering valuable insights into user experience, app health, and performance. With its customizable dashboard, alert system, and integration features, it simplifies the process of identifying and resolving issues, improving overall app quality and user satisfaction. Moreover, the setup is super easy and the price is reasonable compared to other competitors out there. In case you ever need an App Health Monitoring System, Embrace is a great option to consider.
Thank you for reading this far. If you found this article helpful or learned something new, please consider showing your support by liking it and following me for updates on future posts. 🙏🙏🙏